.svg)

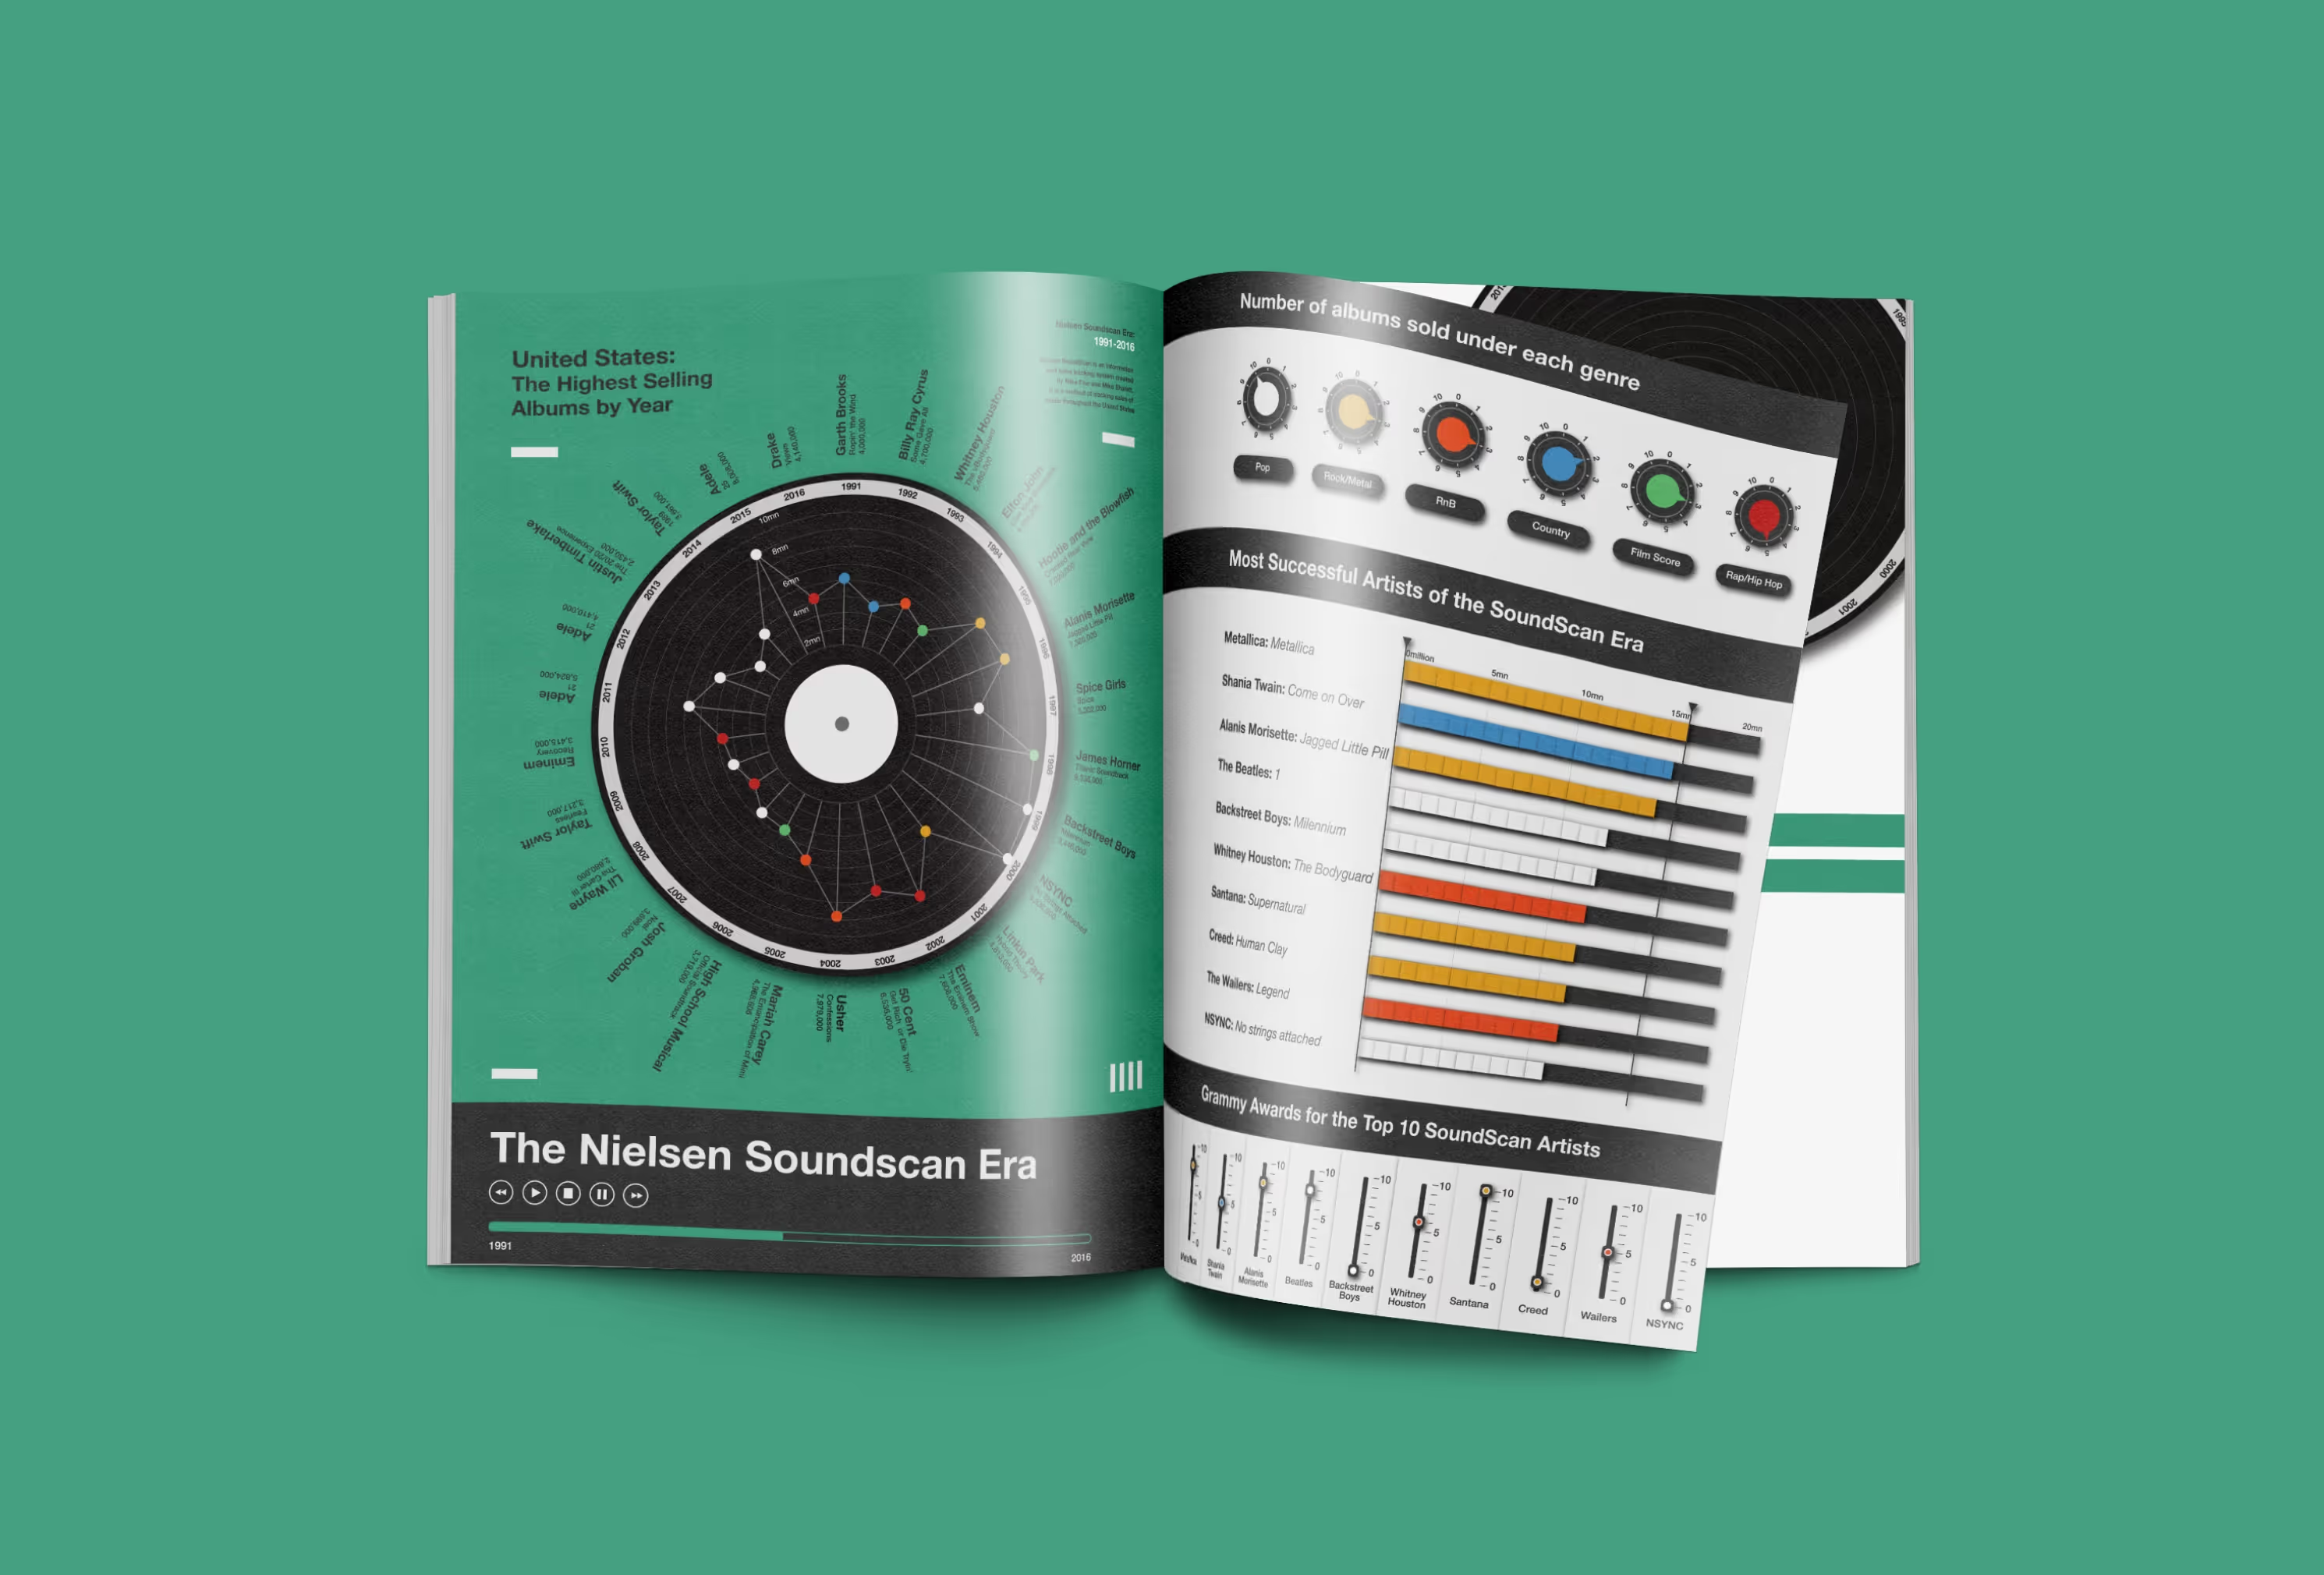
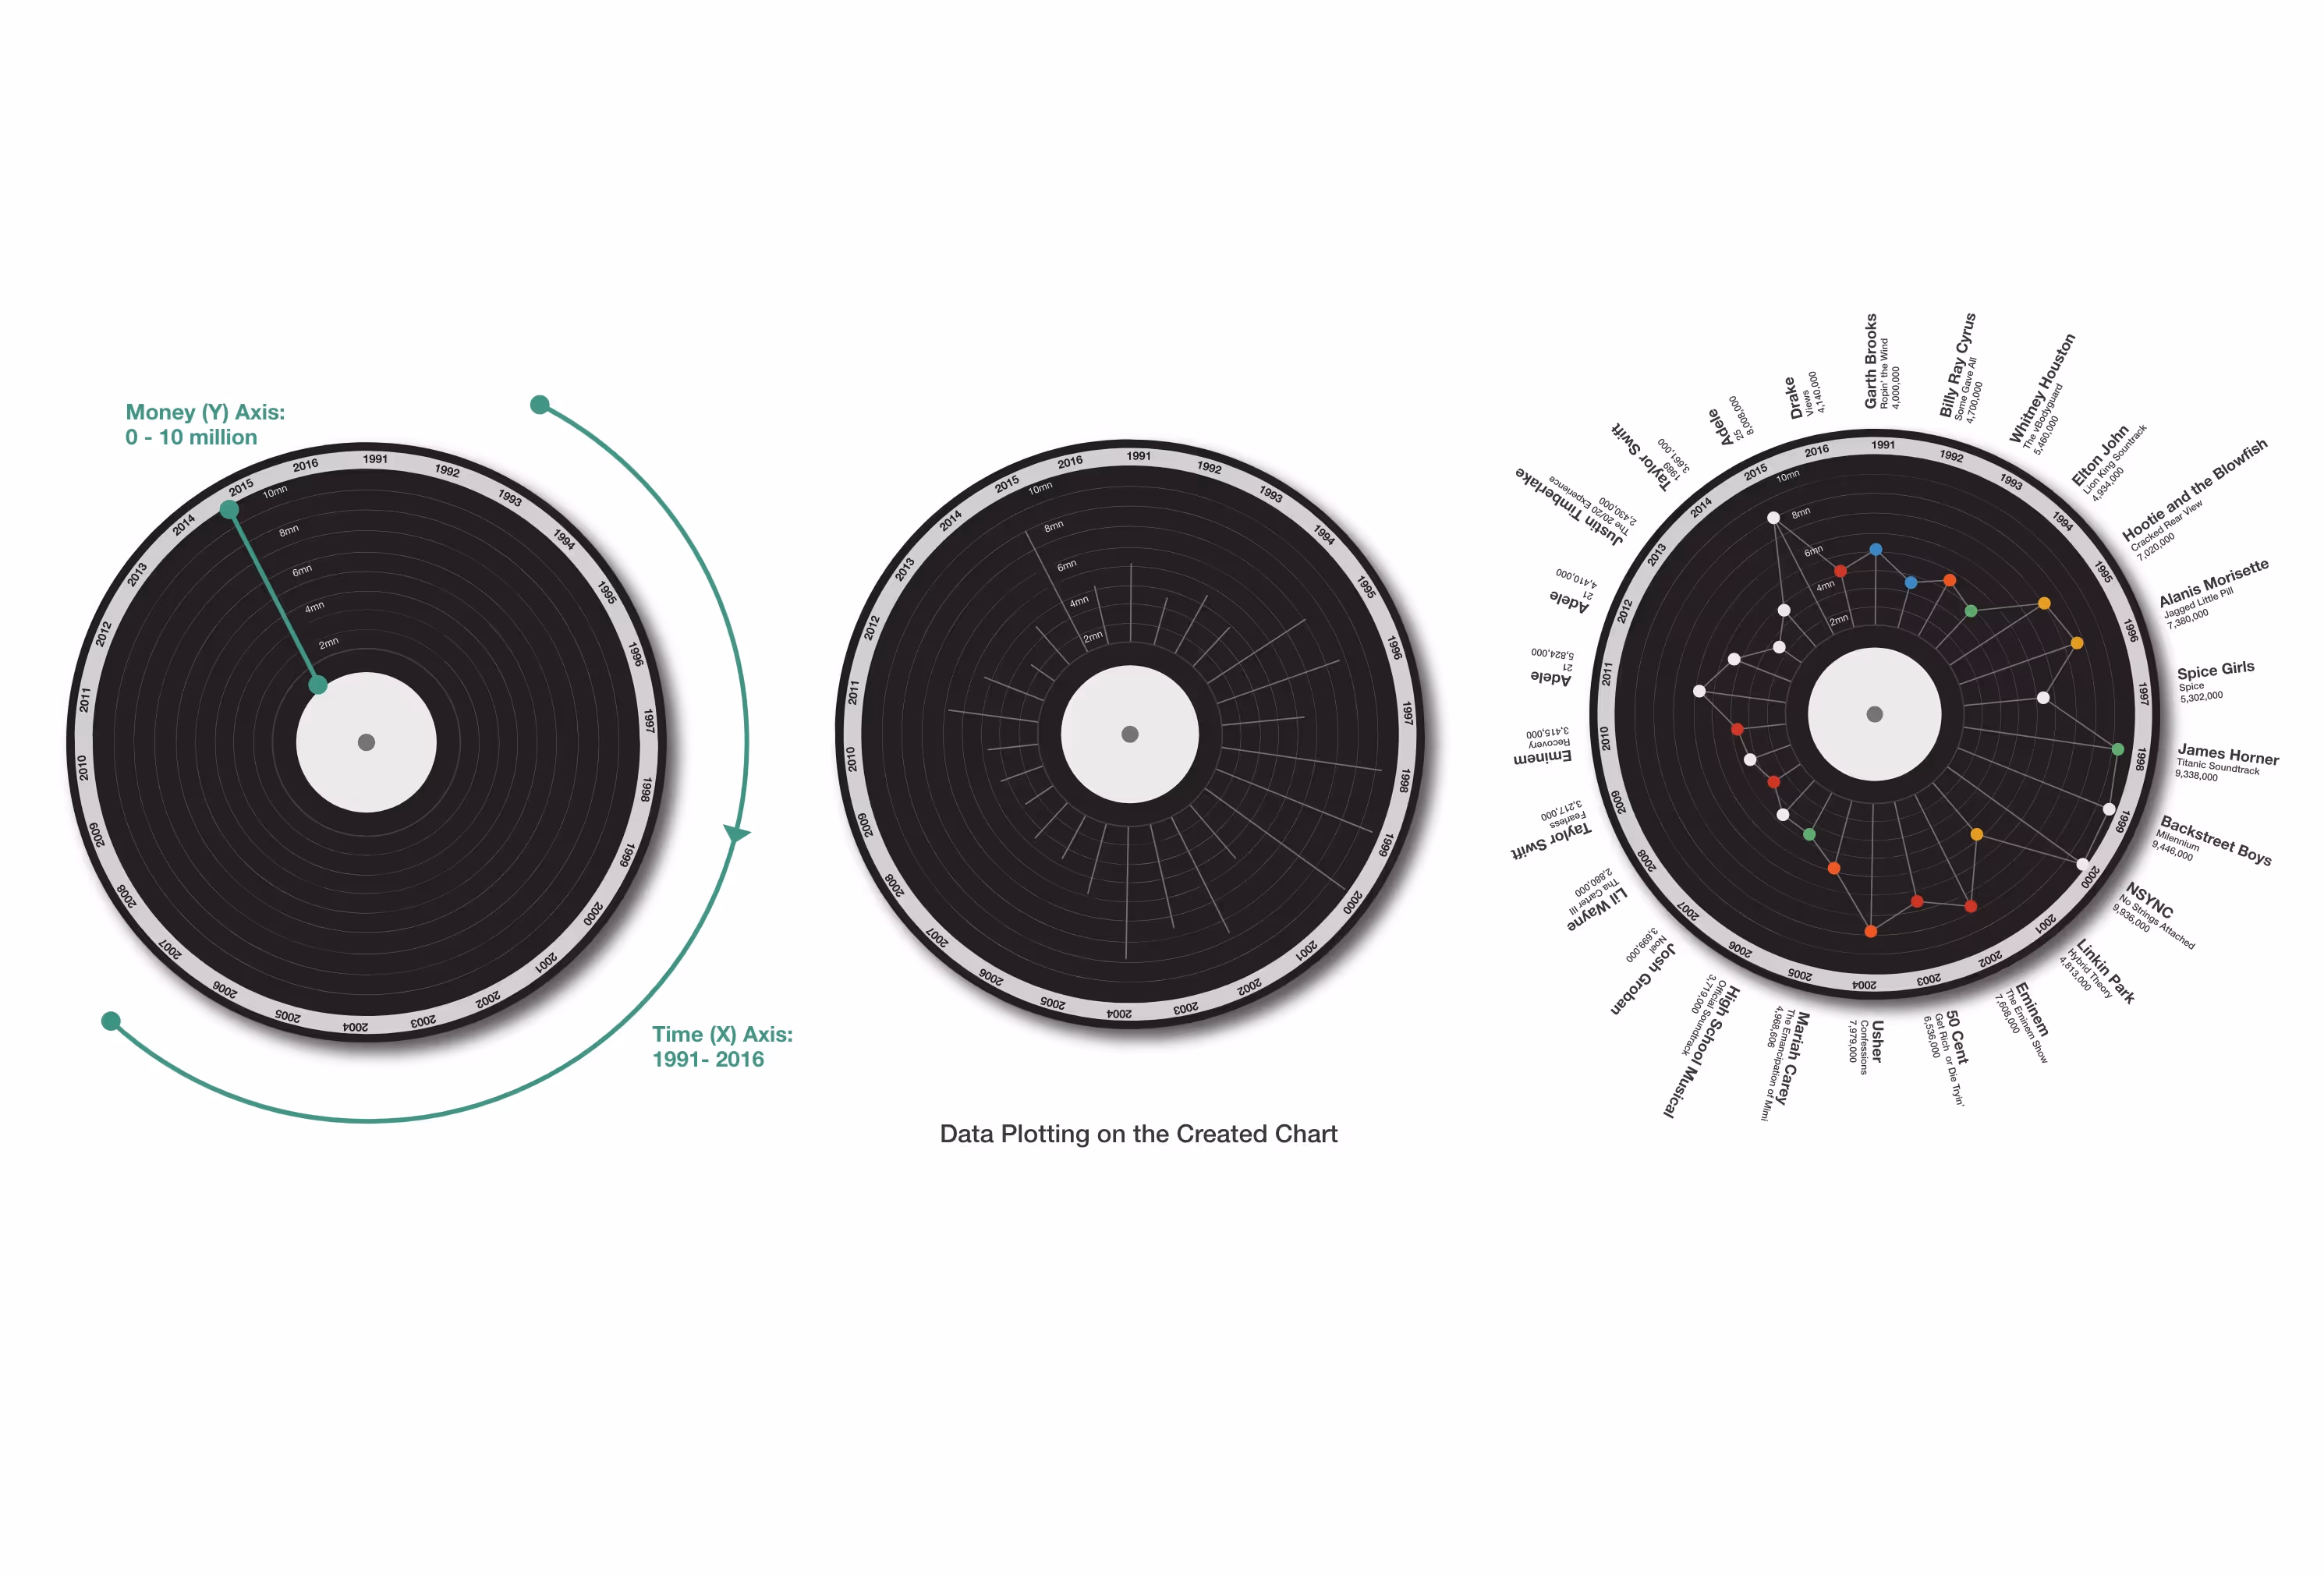
Started in 1991, the Nielsen system is the United States of America's trusted manner of tracking record sales across the country. We wanted to do a visual thinking project where we take four primary comparable data sets from the Nielsen Soundscan charts and compare them visually.
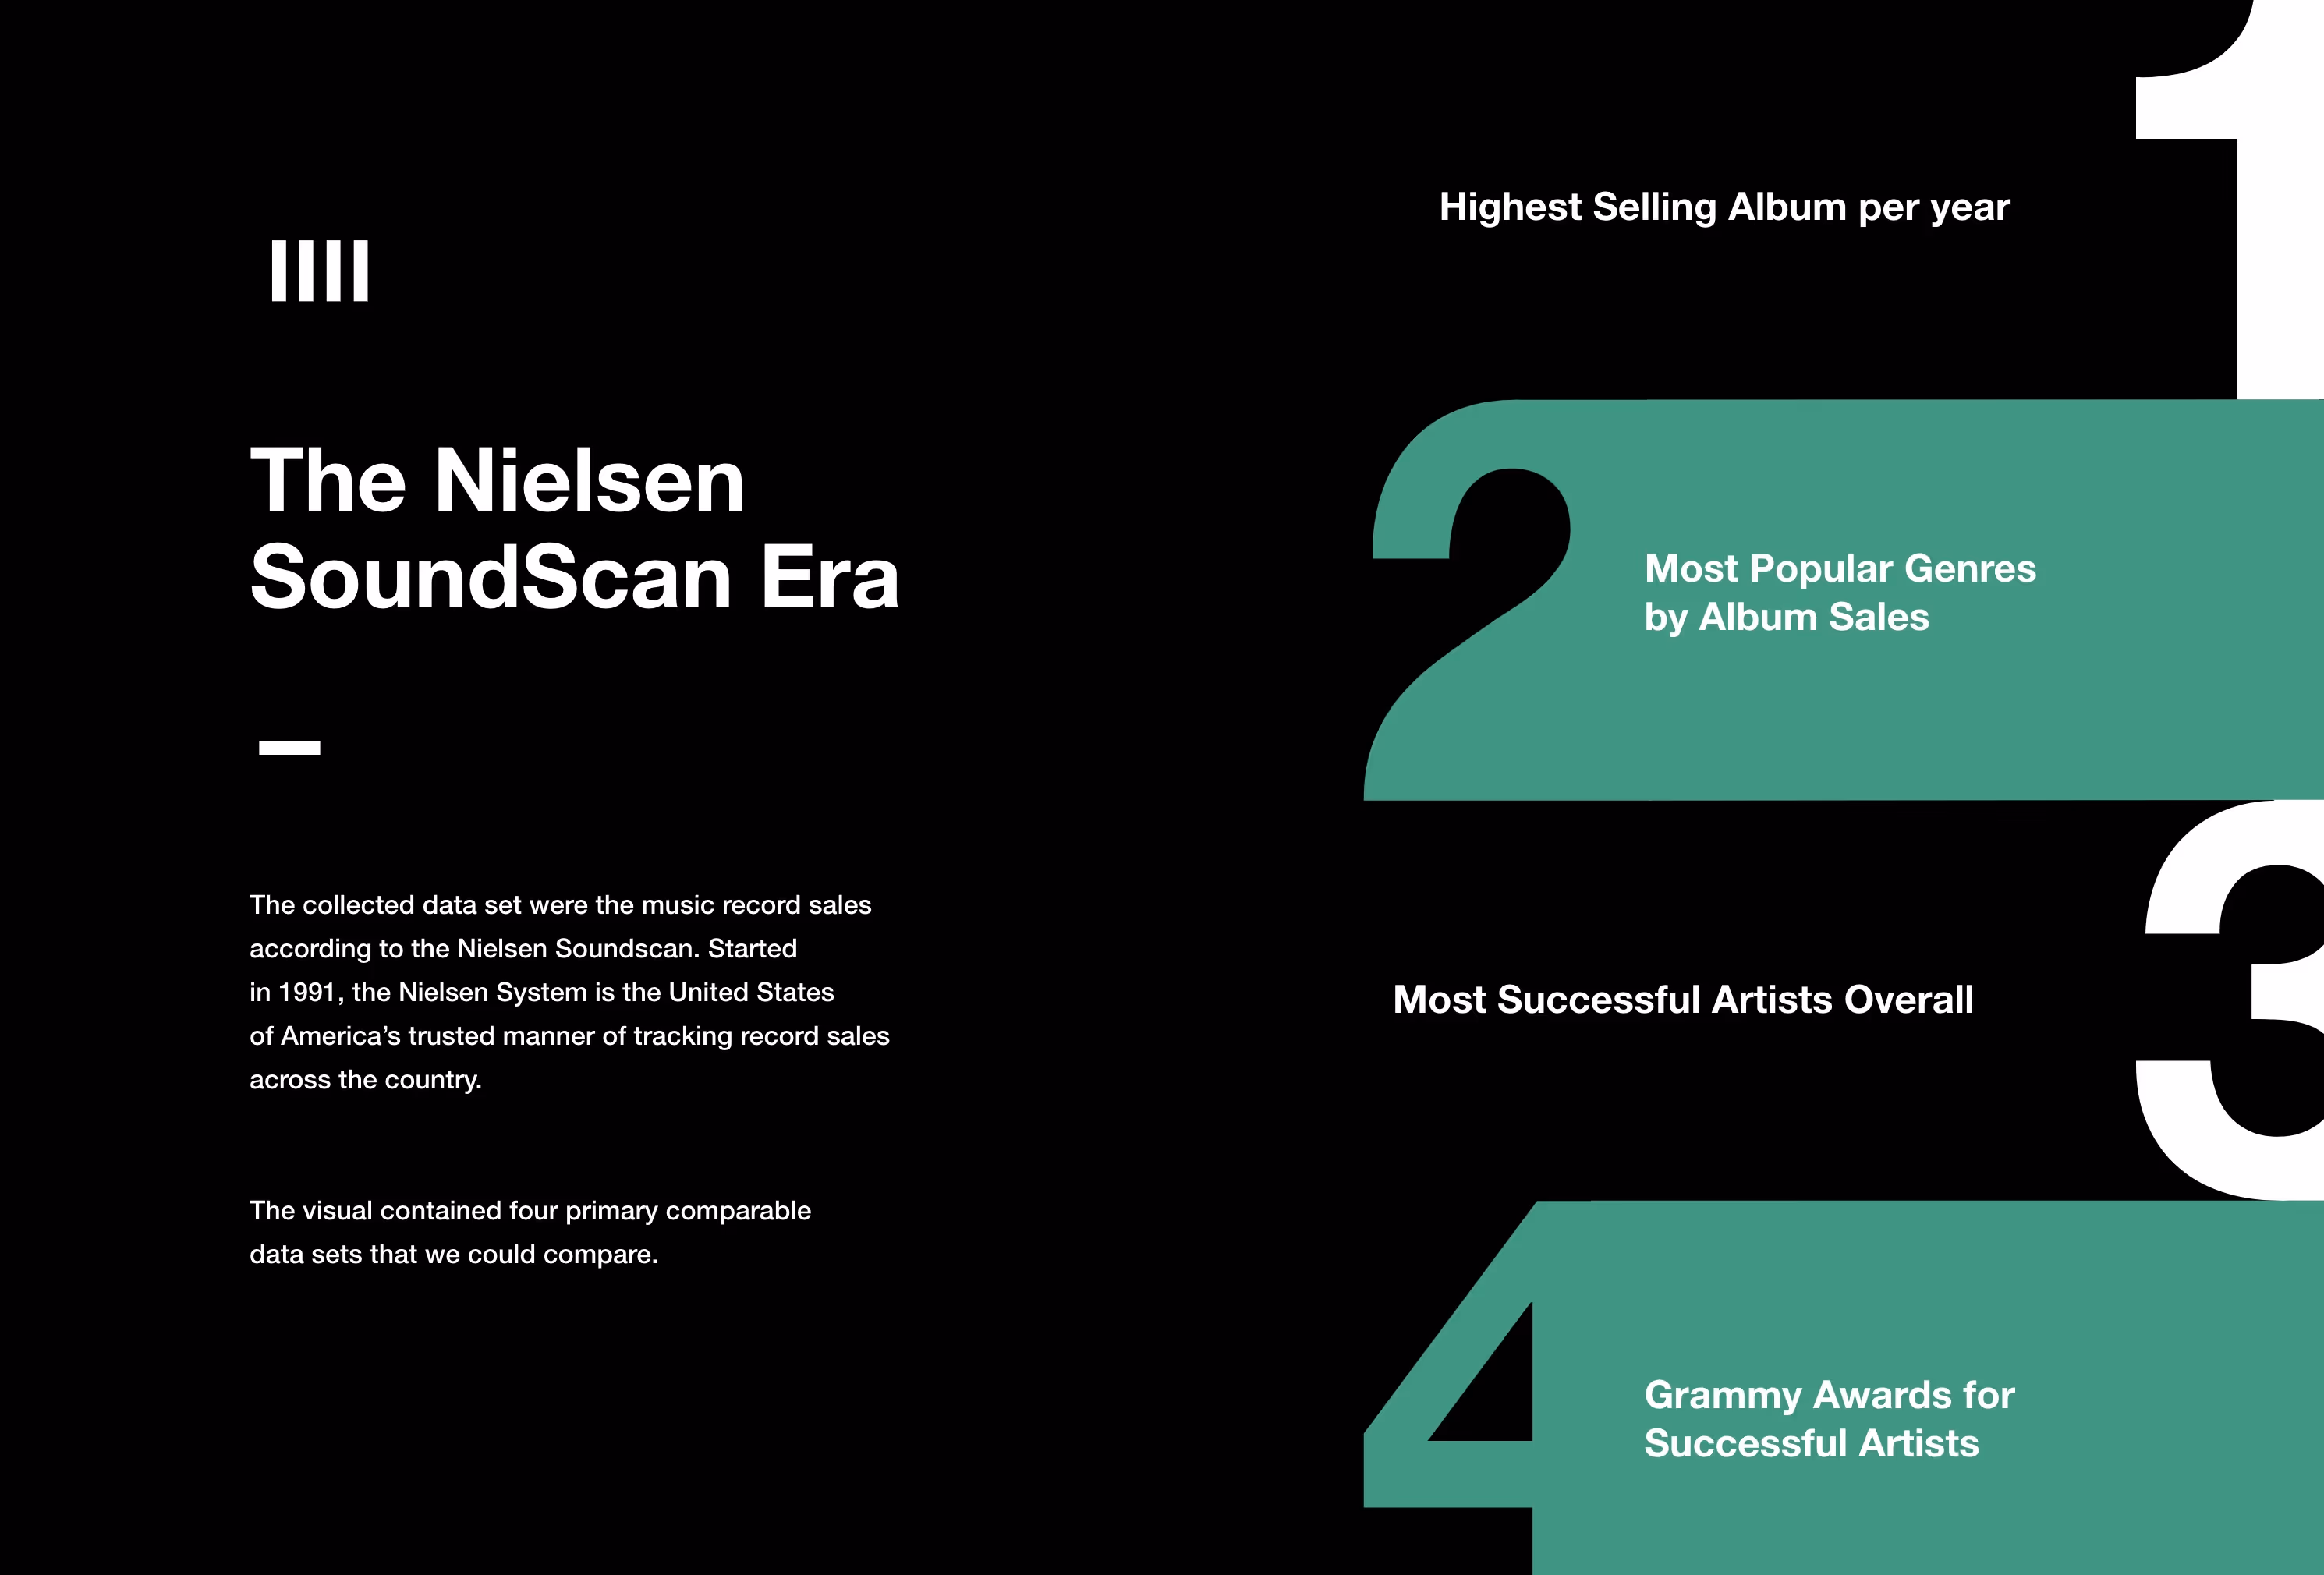

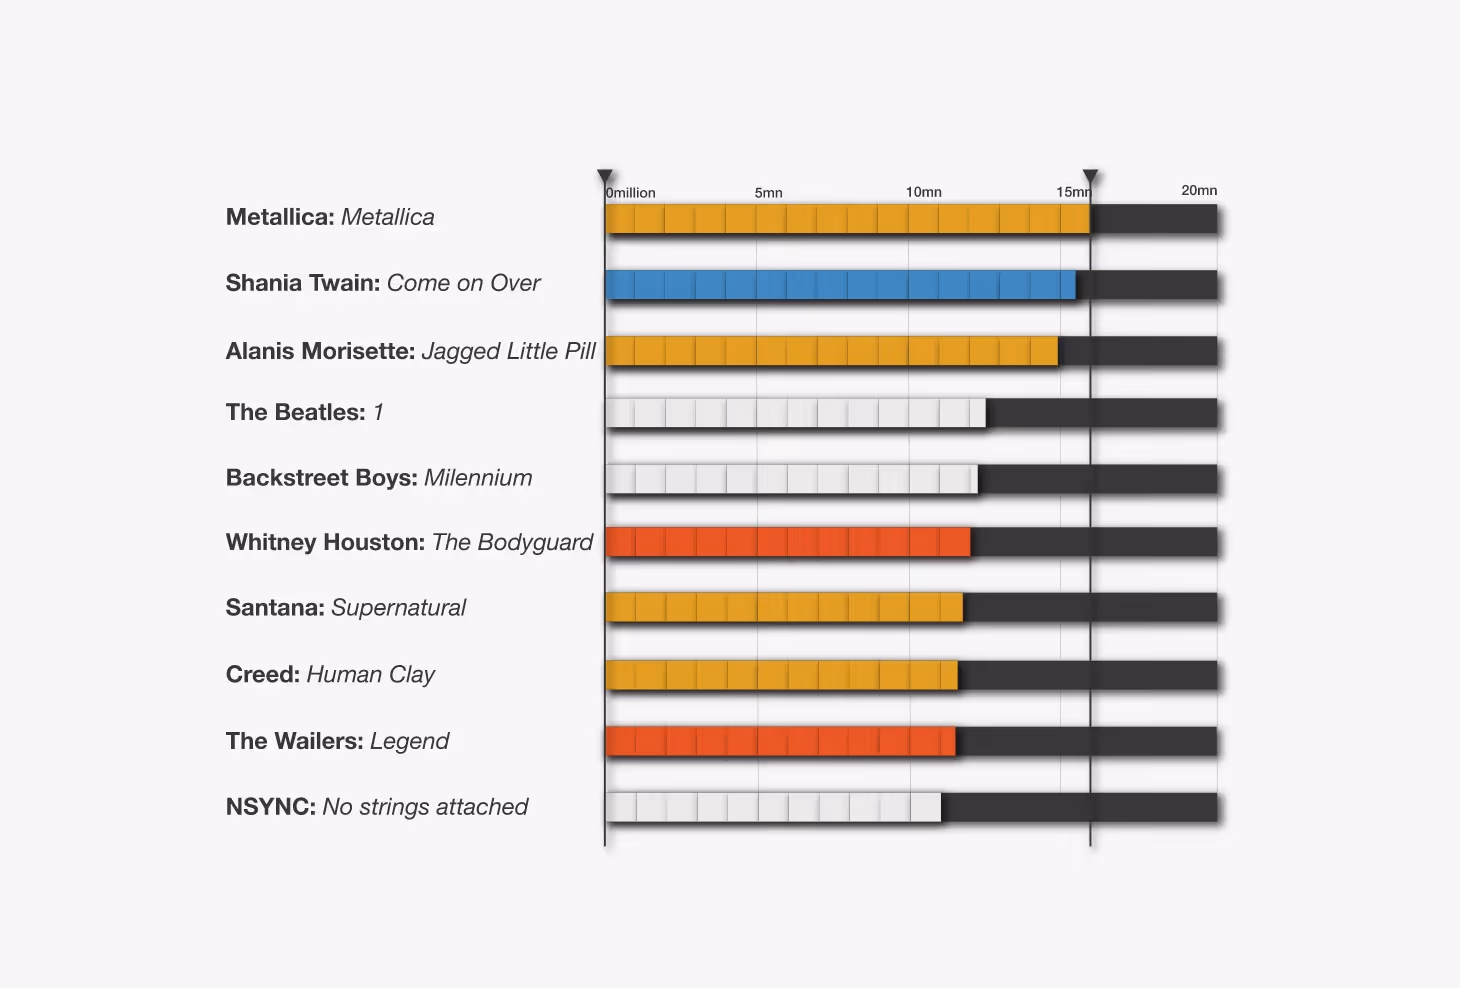
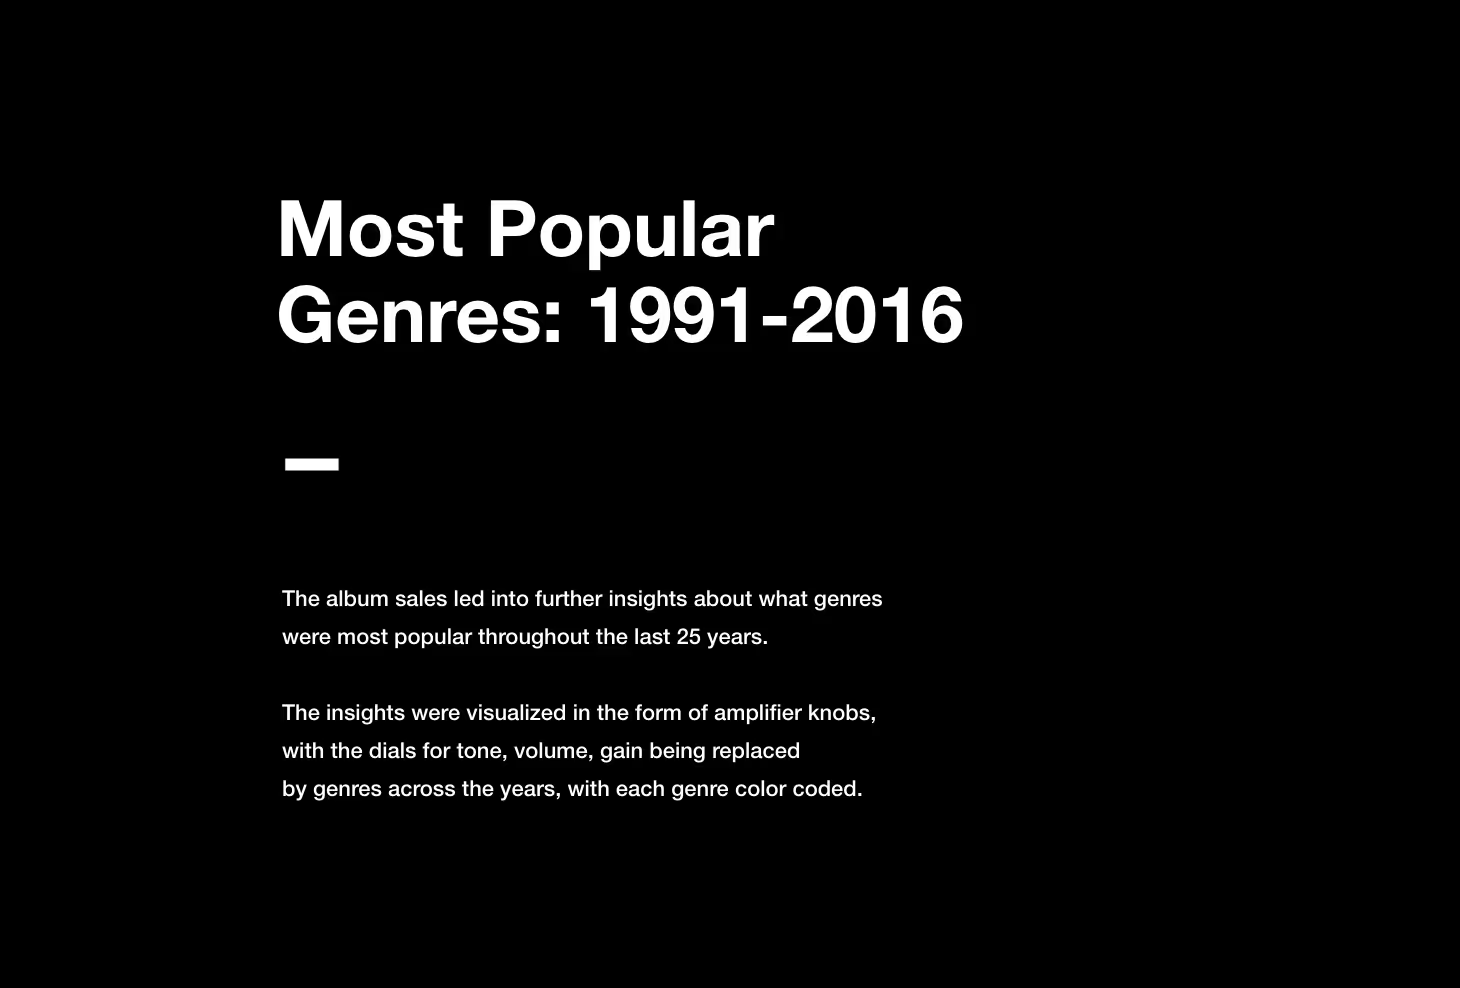
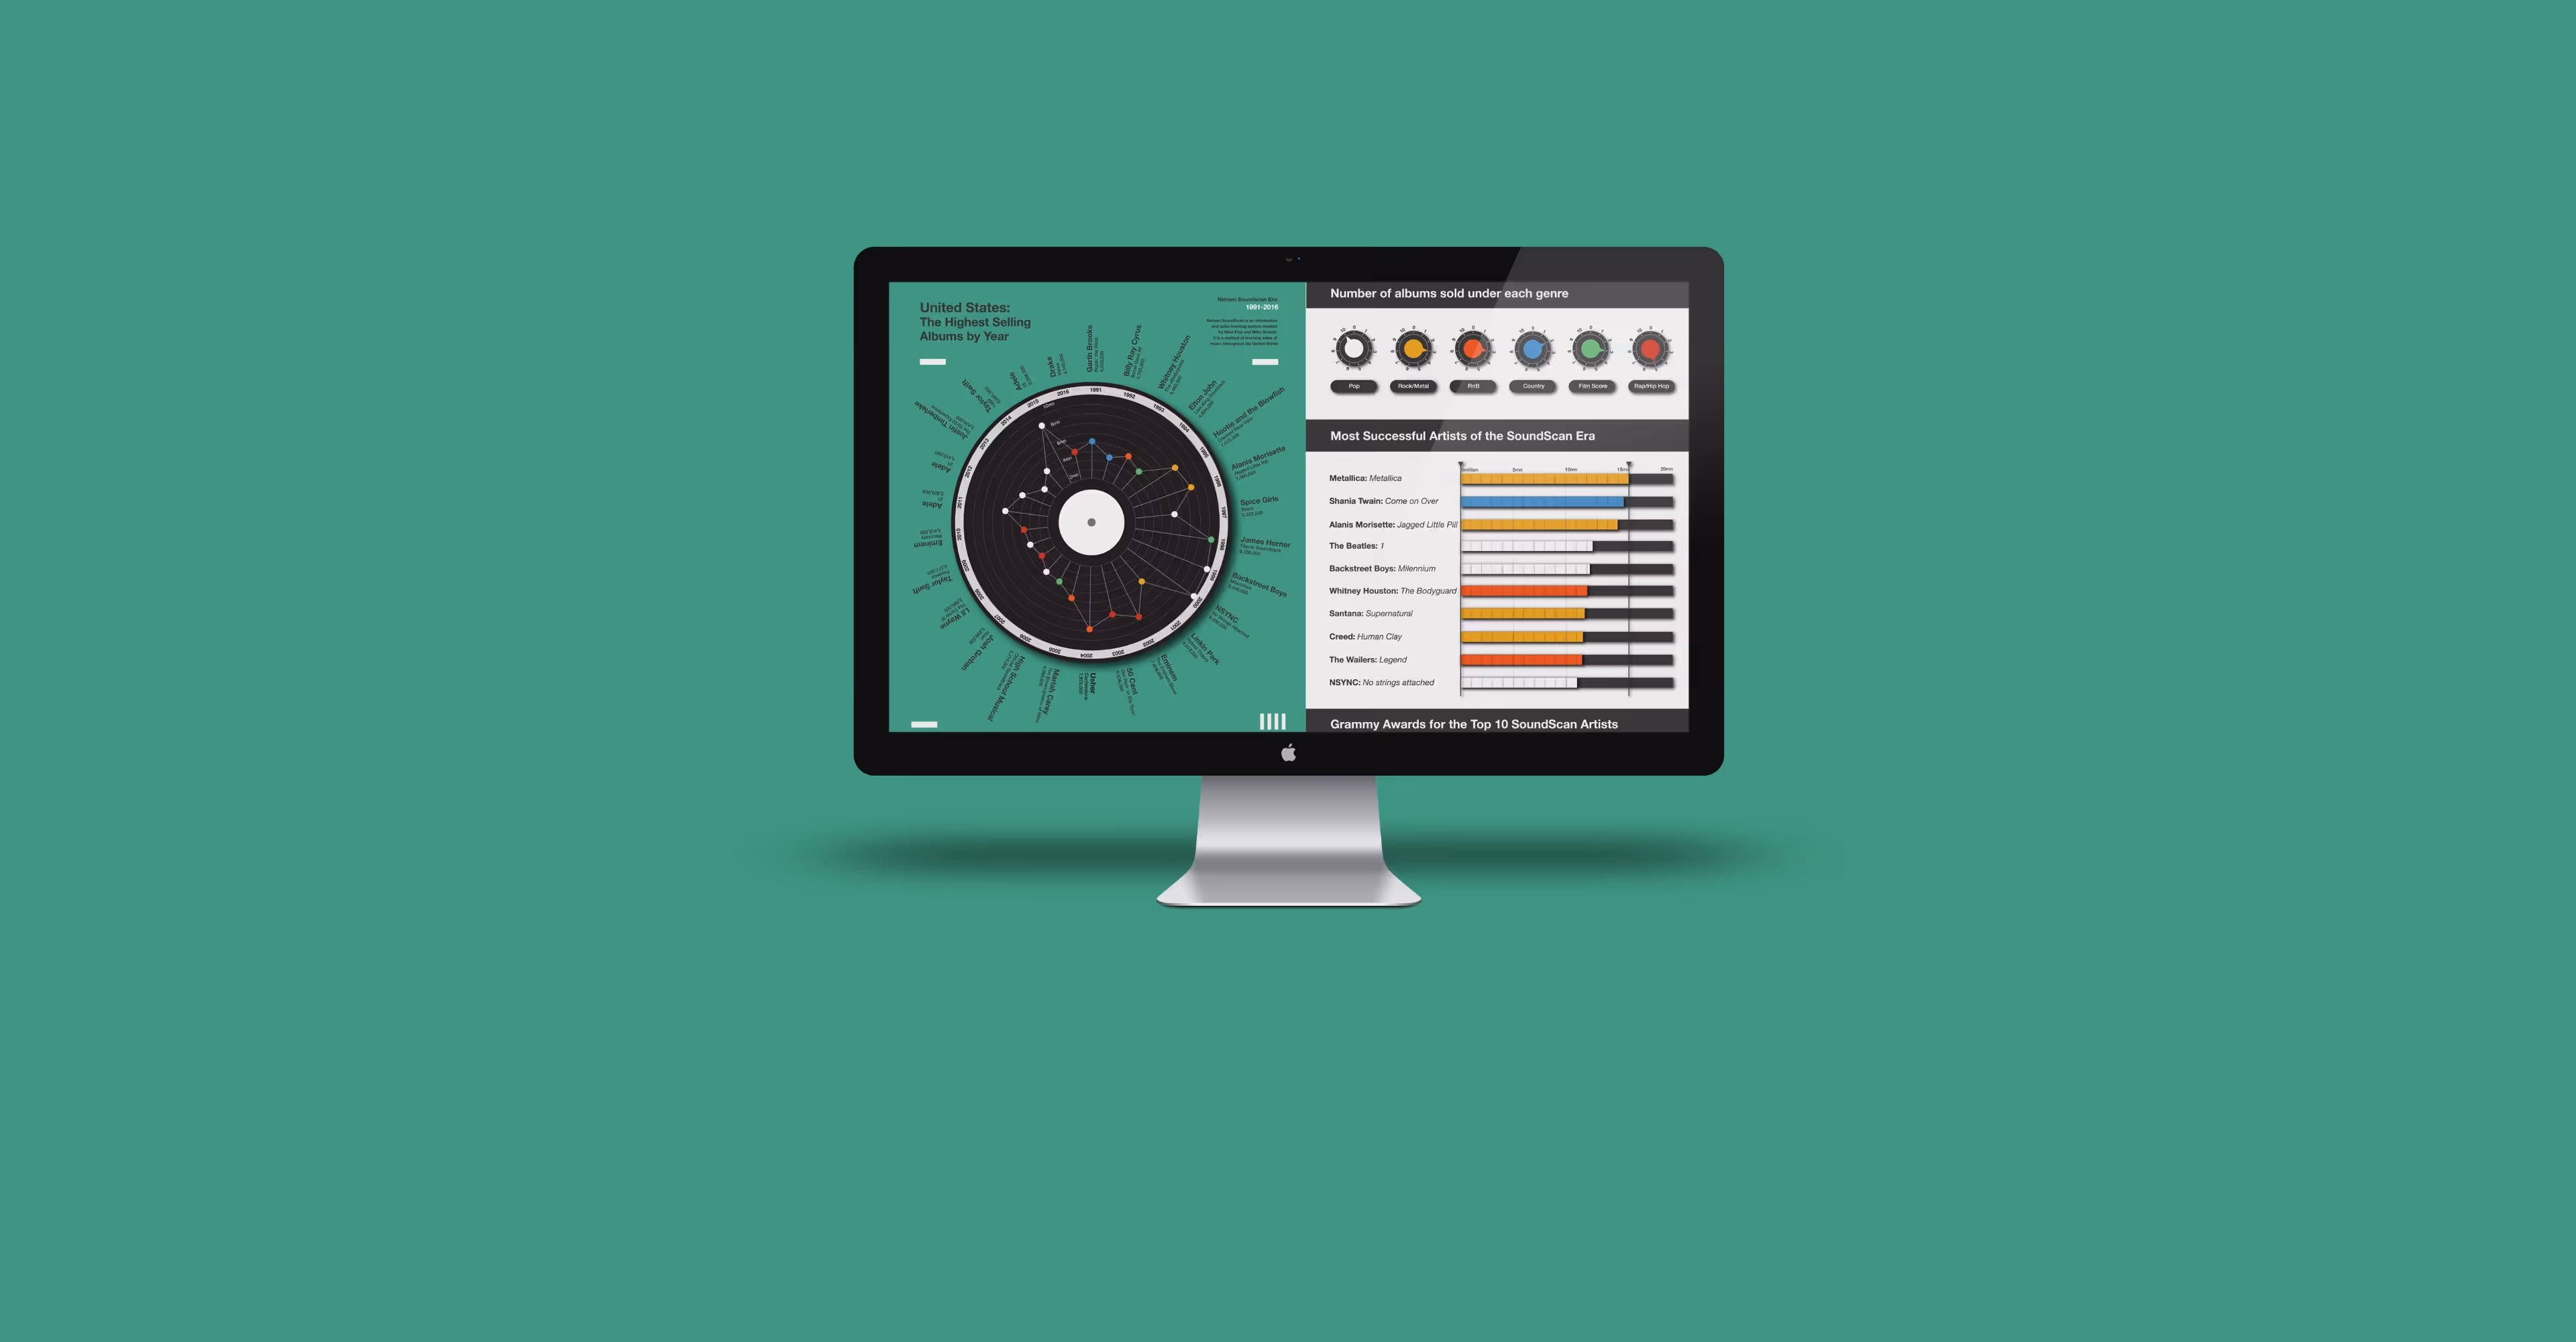
The data sets we collected were the following- highest selling album per year, most popular genres by album sales, most successful artists overall and finally, Grammy awards for successful artists.
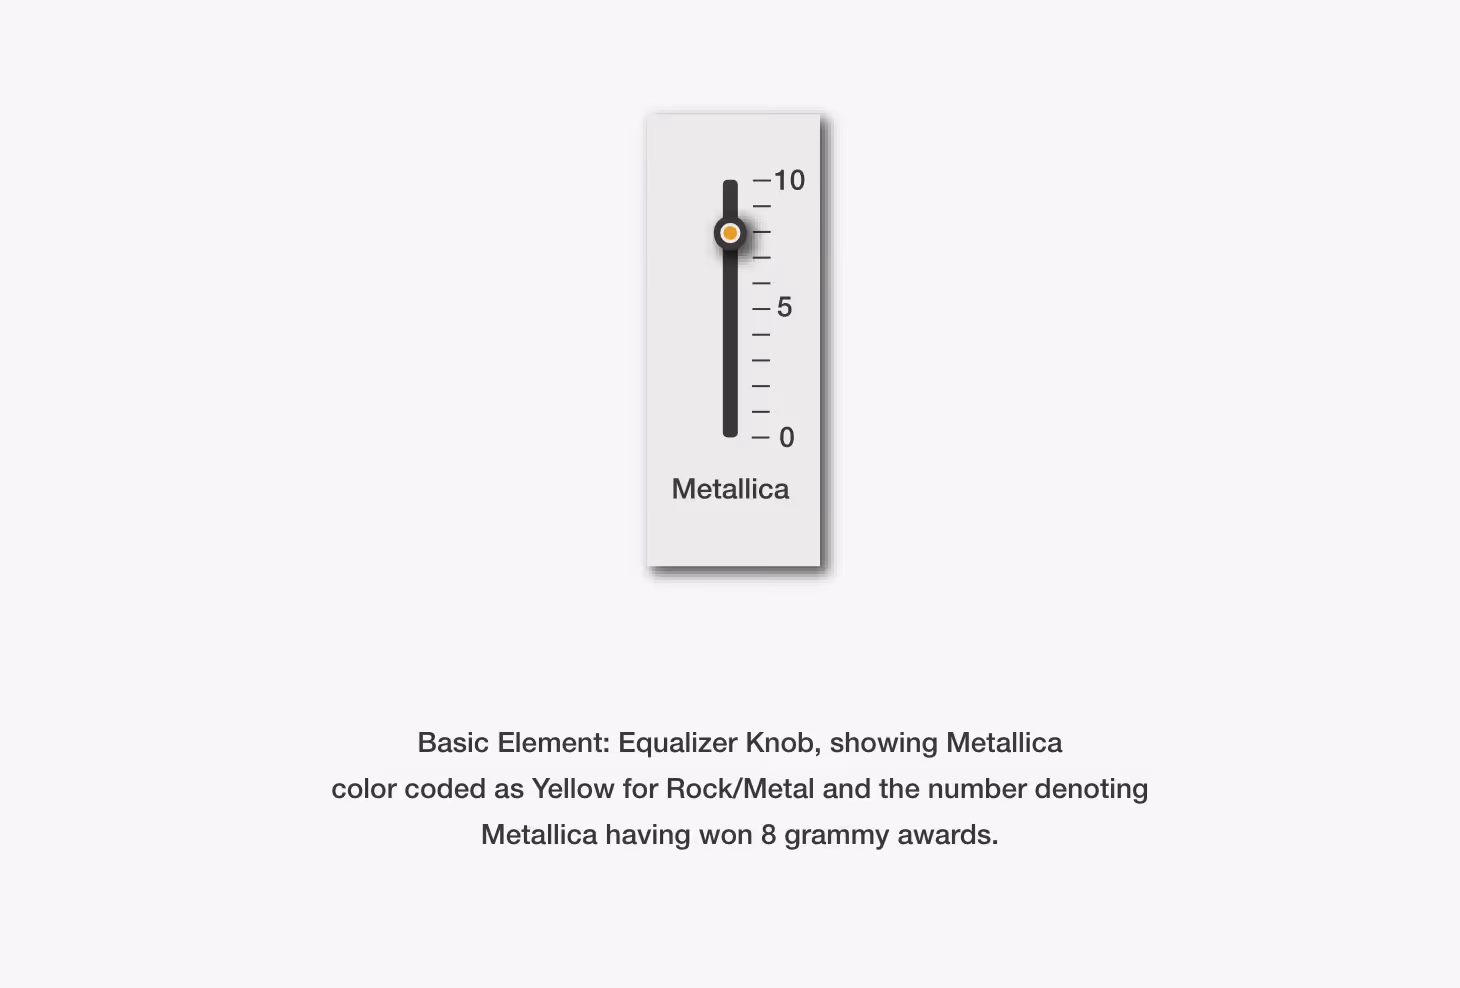
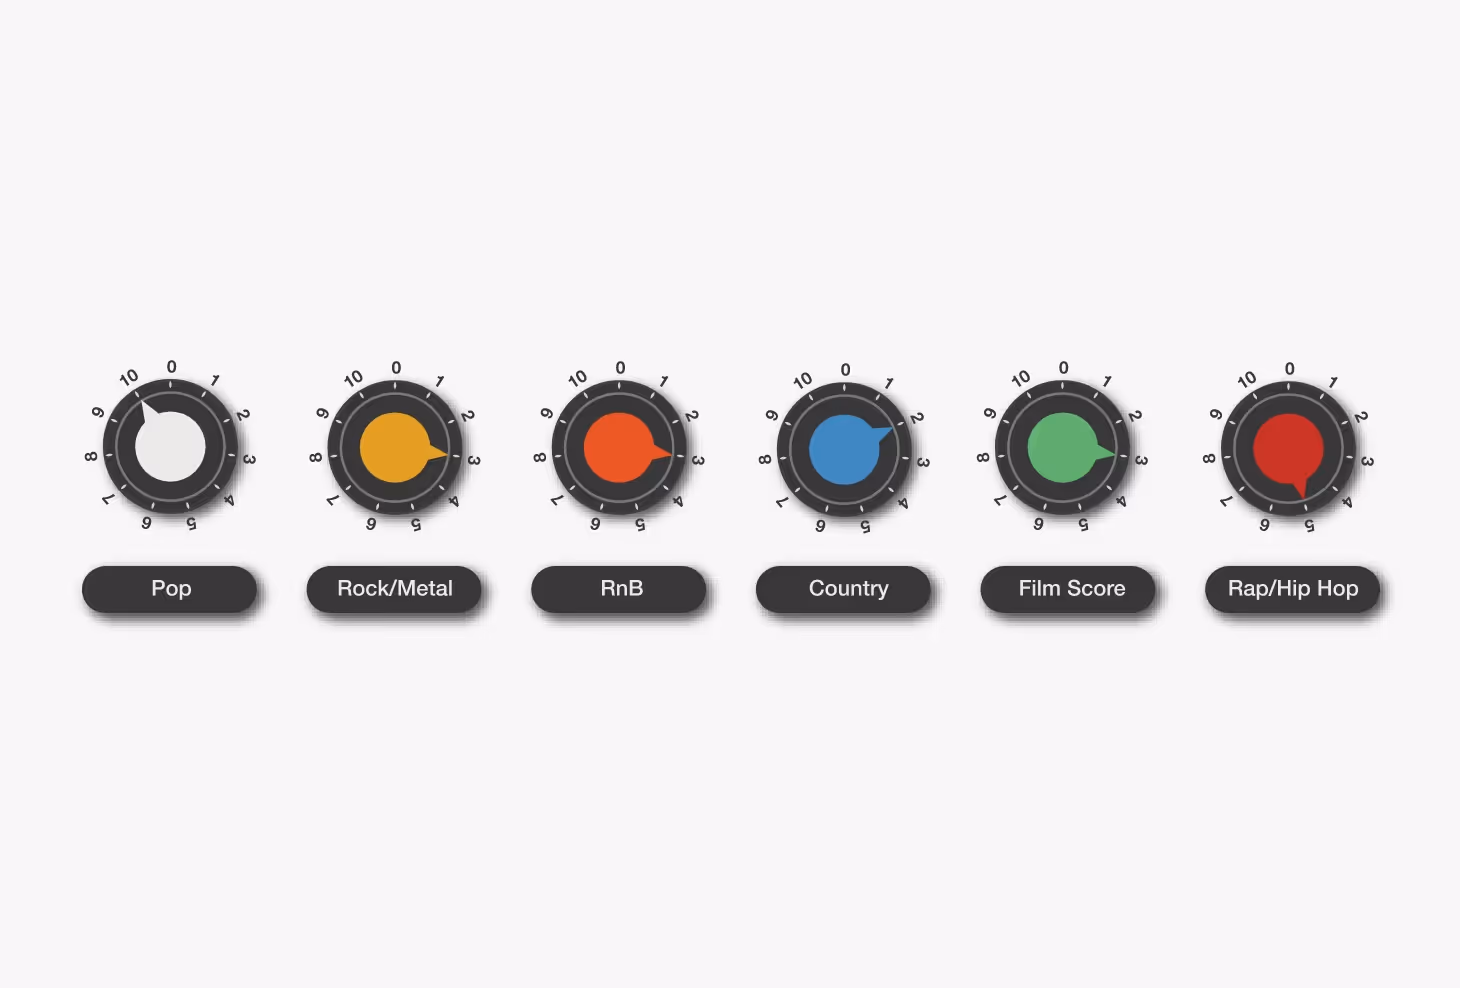
For all the plots we used visuals related to sound recording. From using a Vinyl record to plot the highest selling albums per year, to amplifier knobs for comparing genres by relative sales, instrument labels for artists and finally, equaliser knobs for the Grammy’s dataset. We put all of it together in the form of those popular A4 magazine spreads
The data sets we collected were the following- highest selling album per year, most popular genres by album sales, most successful artists overall and finally, Grammy awards for successful artists.
For all the plots we used visuals related to sound recording. From using a Vinyl record to plot the highest selling albums per year, to amplifier knobs for comparing genres by relative sales, instrument labels for artists and finally, equaliser knobs for the Grammy’s dataset. We put all of it together in the form of those popular A4 magazine spreads